Event description
Notes and links to support the Data Democratisation panel, 2023 Science Communicators Association of New Zealand Conference: Techtopia: Navigating the power, potential and perils of technology in science communication.
November 16 & 17, 2023 in Te Whanganui-a-Tara Wellington, Aotearoa New Zealand.
A panel discussion following Karaitiana Taiuru’s keynote.
Speakers
Dr Karaitiana Taiuru, Taiuru
Keith Ng, Ministry of Housing and Urban Development
Liza Bolton, University of Auckland
Moved by data
“It is the mark of a truly intelligent person to be moved by statistics”
George Bernard Shaw, Bertrand Russell (kinda)
Oft mis-attributed to George Bernard Shaw (what an excellent quipper to be in company with!), this quote has been versioned and recycled across time. It was really about education and developing people’s sympathies to the point that abstract information about the world could be as moving, and thus motivating, as a really personal story from a specific person.
Intelligence is notoriously problematic to measure (probably because it is notoriously poorly defined…), so I’d propose a variation…“good science communication can help all people be moved by statistics, or with the help of them”.
…Not as catchy, guess I’ll stick to my day job.
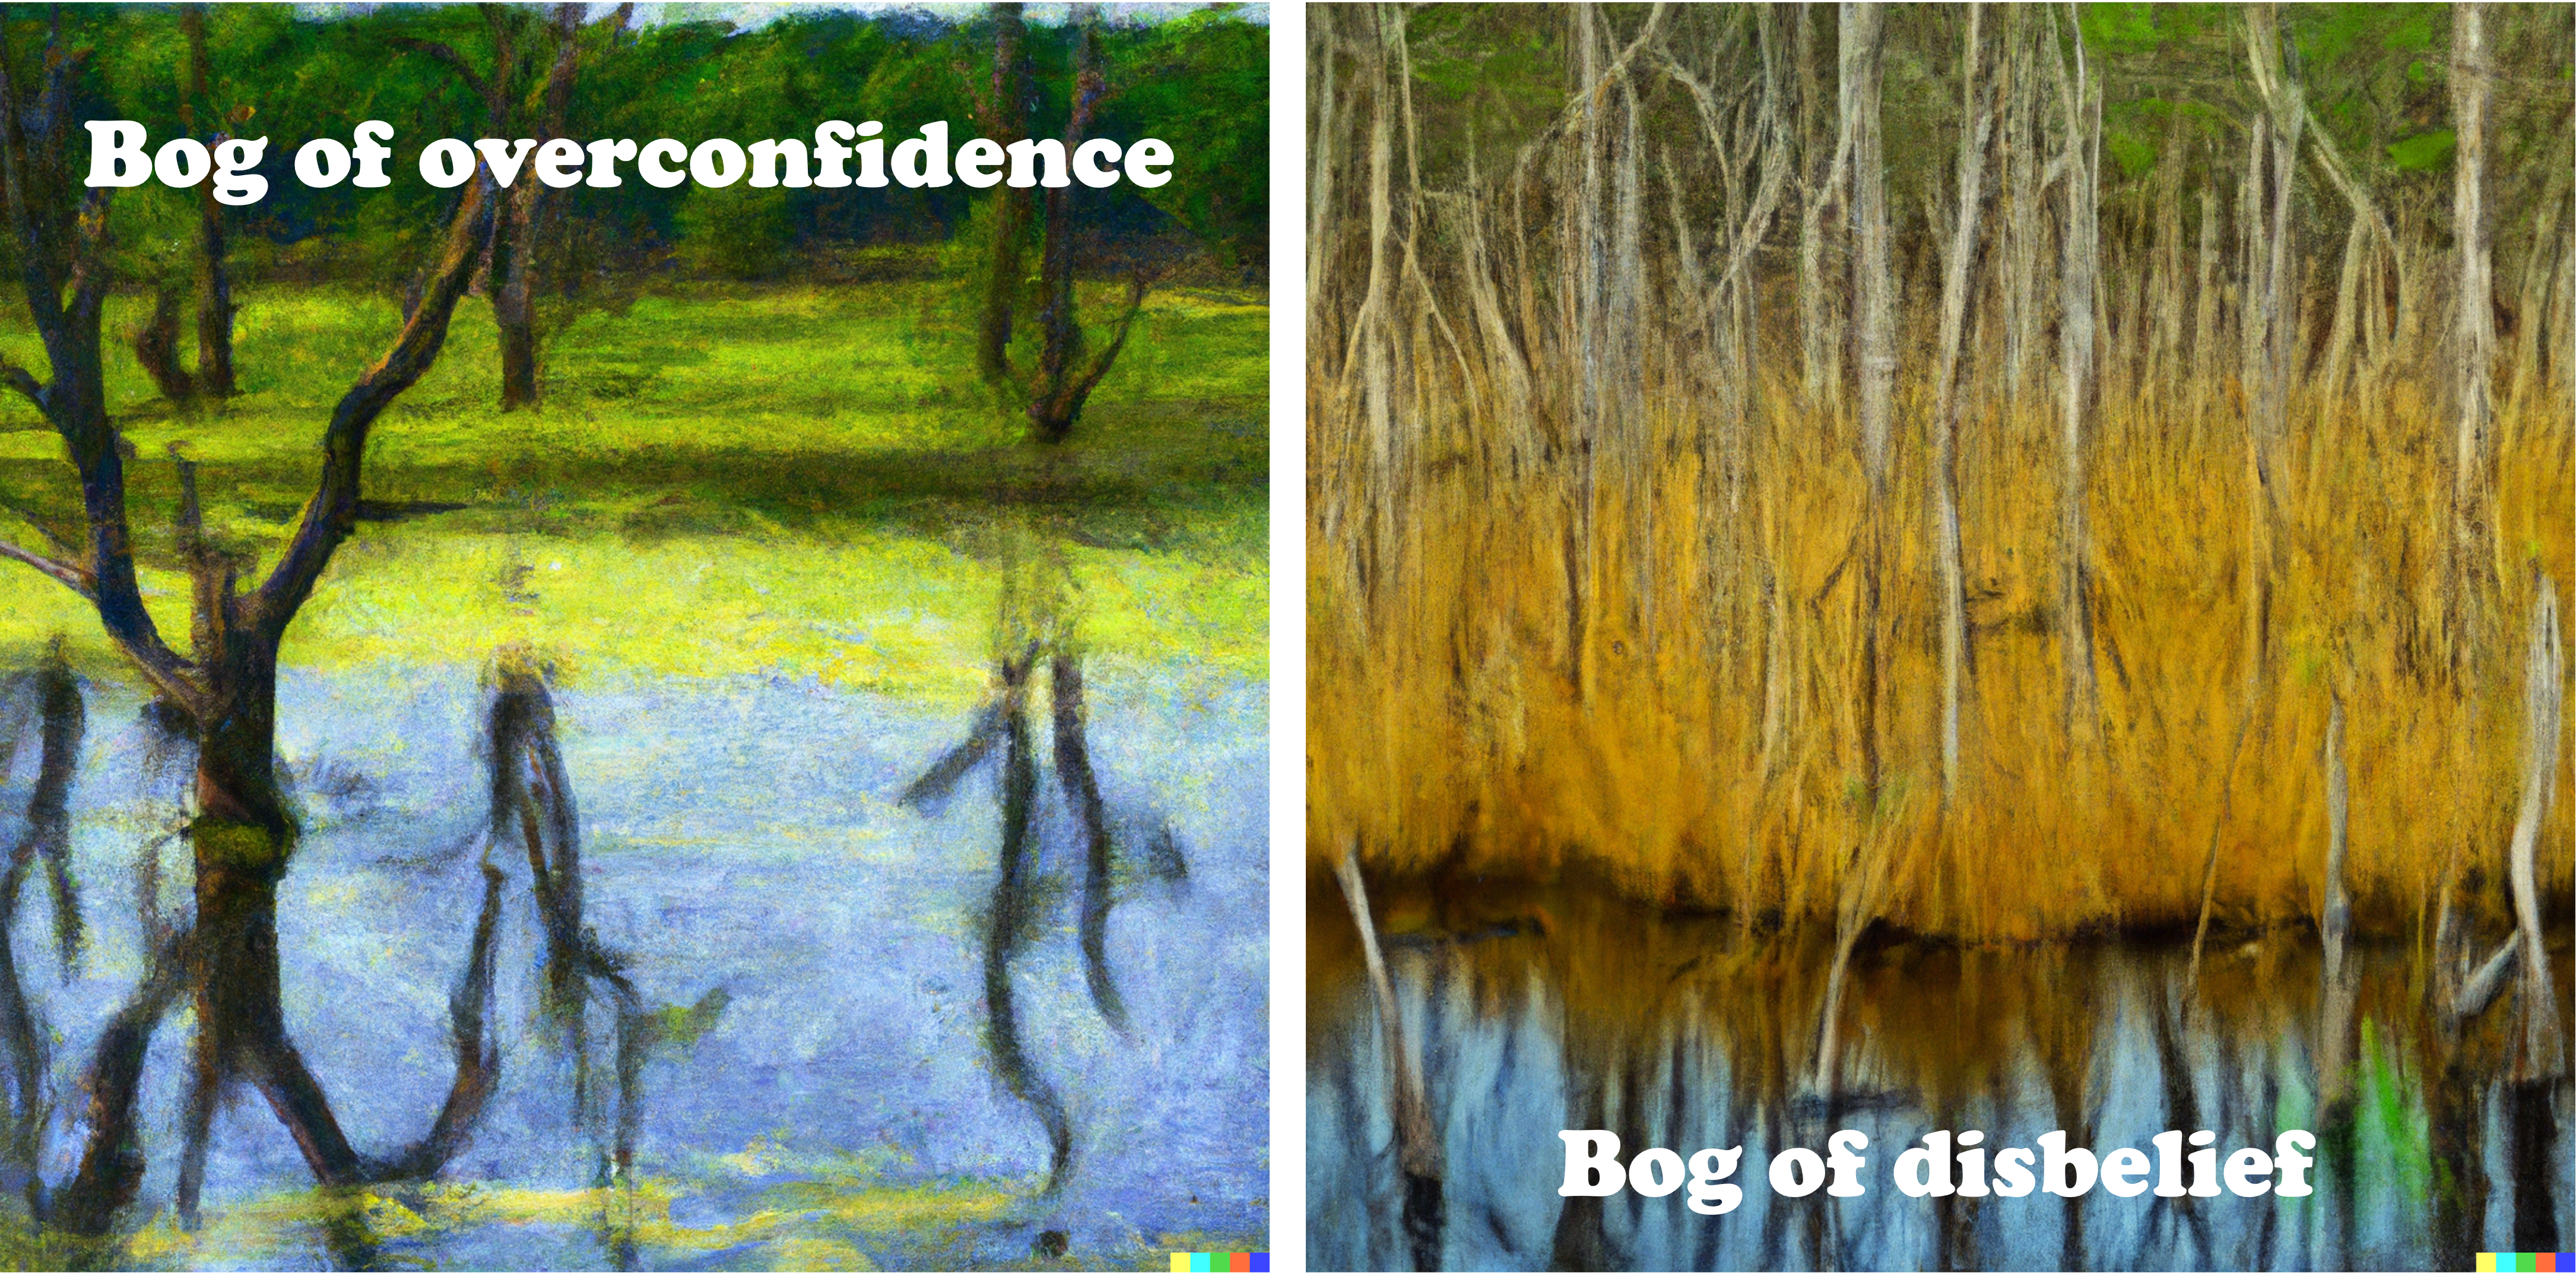
The statistical-thinking bogs
Post-panel note: I was thrilled to hear how many people found this a really useful framework!
The following is about students in intro stats classes, but I think it is also really helpful for checking in on your own thinking and anticipating how others may engage with your communication about data and models.
…students tend to enter and leave most introductory statistics courses thinking of statistics in one of at least two incorrect ways:
1. Students believe that statistics and mathematics are similar in that statistical problems have a single correct answer; an answer that tells us indisputable facts about the world we live in (Bog #1: overconfidence) (Nicholson & Darnton, 2003; Pfannkuch & Brown, 1996),
or,
2. Students believe that statistics can be ‘made to say anything,’ like ‘magic,’ and so cannot be trusted. Thus, statistics is viewed as disconnected and useless for scientific research and society (Bog #2: disbelief) (Martin, 2003; Pfannkuch & Brown, 1996).
Tintle, N., Chance, B., Cobb, G., Roy, S., Swanson, T., & VanderStoep, J. (2015). Combating Anti-Statistical Thinking Using Simulation-Based Methods Throughout the Undergraduate Curriculum. The American Statistician, 69(4), 362–370. http://www.jstor.org/stable/24592138
📄 PDF: https://arxiv.org/pdf/1508.00543.pdf
Three archetypes of data stories
This didn’t come up in the talk itself, but for those communicating with and about data, I think you could claim that there are three data story archetypes. Most situations include parts of all three of these, but I think it can help to consider their interplay in the data you’re collecting, using or disseminating.
- Means to an end
- Means (to an end?)
Means to an end
Means to an end
Data was needed and used to tell a story, but the data itself isn’t a big part of the story, just enabling answering the research question. If you could wave a magic wand that guaranteed the data was appropriately collected and measured for your research question, you’d not need to talk about it all. 🪄 But of course, the worthiness of the research question itself is important, too! And I’m honestly not sure this truly exists in the real world, I suppose neither of the first two archetypes really exist in full purity…but folks certainly might present things like this.
👎 5D approaches to indigenous data
Statistics have long been used as a tool for shaping the narrative about Indigenous People, communities, and nations through the use of 5 D data—"a set of items related almost exclusively to measure Indigenous difference, disparity, disadvantage, dysfunction and deprivation". This pathologizing approach to data creation and analysis has led to dysfunctional policies that are then used to justify the need for more data focused on the 5 Ds and that shape dominant society's understanding of Indigenous People.
~ From Indigenous Data Sovereignty and Policy edited by Maggie Walter, Tahu Kukutai, Stephanie Russo Carroll, and Desi Rodriguez-Lonebear
Taylor & Francis, 2021
👍 Journos adding data notes
I’m seeing more an more a little (or not so little) data notes portion at the end of articles. This is a great way to balance what flows in an article and isn’t the core story, with allowing folks who want to sink their teeth in further. To be fair these examples are very much data journalism, so these are the folks rocking it!
Kate Newton for the ABC, The Big Swing: El Niño in a changing climate
The Pudding are leaders in this space: What does a happily ever after look like?by Alice Liang (with Jan Diehm). Lovely, succinct Methods & Notes section at the end.
Measurement is hard
There is so much to this, but there is an incredible anecdote in the book The Victory Lab: The Secret Science of Winning Campaigns by Sasha Issenberg that also highlights why our STEM folks need exposure to ethics and humanities. It goes something like so: In a meeting on collecting data to try to assess the possible impacts of racist sentiments among voters on Obama’s campaign, one of the suggestions from a hot shot data wonk from MIT (or something like that) was that they just ask people in surveys if they were racist…then you’d know if they were racist. Yep, that is definitely a suggestion.
Means (to an end?)
This is when the data is the story itself. Whether related to privacy, consent, data sovereignty, etc., even without any particular ‘finding’, there are concerns/conversations about the data. Often this is because of the risks of misusing the data, but these don’t have to have eventuated.
Open data & government data
📣 Panellist Keith Ng’s 2017 article on open data: I'm a data nerd and a data cheerleader, but still I fear Bill English's datatopia, on the Spinoff
- It was actually thanks to this article that I first met Keith!
Check out Caleb Moses’ essay in Shouting Zeros and Ones: Digital Technology, Ethics and Policy in New Zealand edited by Andrew Chen
Herald data journo Chris Knox spotted an issue with data from three polling places in the recent election. While in the end this didn’t change an outcome, this is an important issue for the Electoral Commission to be aware of and work on.
👍 Datasheets for explaining data
While the article is specifically about machine learning, the questions worked through when creating a datasheet are valuable for sharing any kind of dataset in an accessible and consistent way.
Gebru, Timnit, Jamie Morgenstern, Briana Vecchione, Jennifer Wortman Vaughan, Hanna Wallach, Hal Daumé III, and Kate Crawford. 2021. “Datasheets for Datasets.” Communications of the ACM 64 (12): 86–92. https://doi.org/10.1145/3458723.
Datasheets for datasets are intended to address the needs of two key stakeholder groups: dataset creators and dataset consumers. For dataset creators, the primary objective is to encourage careful reflection on the process of creating, distributing, and maintaining a dataset, including any underlying assumptions, potential risks or harms, and implications of use. For dataset consumers, the primary objective is to ensure they have the information they need to make informed decisions about using a dataset. Transparency on the part of dataset creators is necessary for dataset consumers to be sufficiently well informed that they can select appropriate datasets for their chosen tasks and avoid unintentional misuse.
📄 Article PDF: https://arxiv.org/pdf/1803.09010.pdf
++ A worked example for the awesome textbook by Rohan Alexander, Telling Stories with Data https://tellingstorieswithdata.com/25-datasheet.html
Means to an end
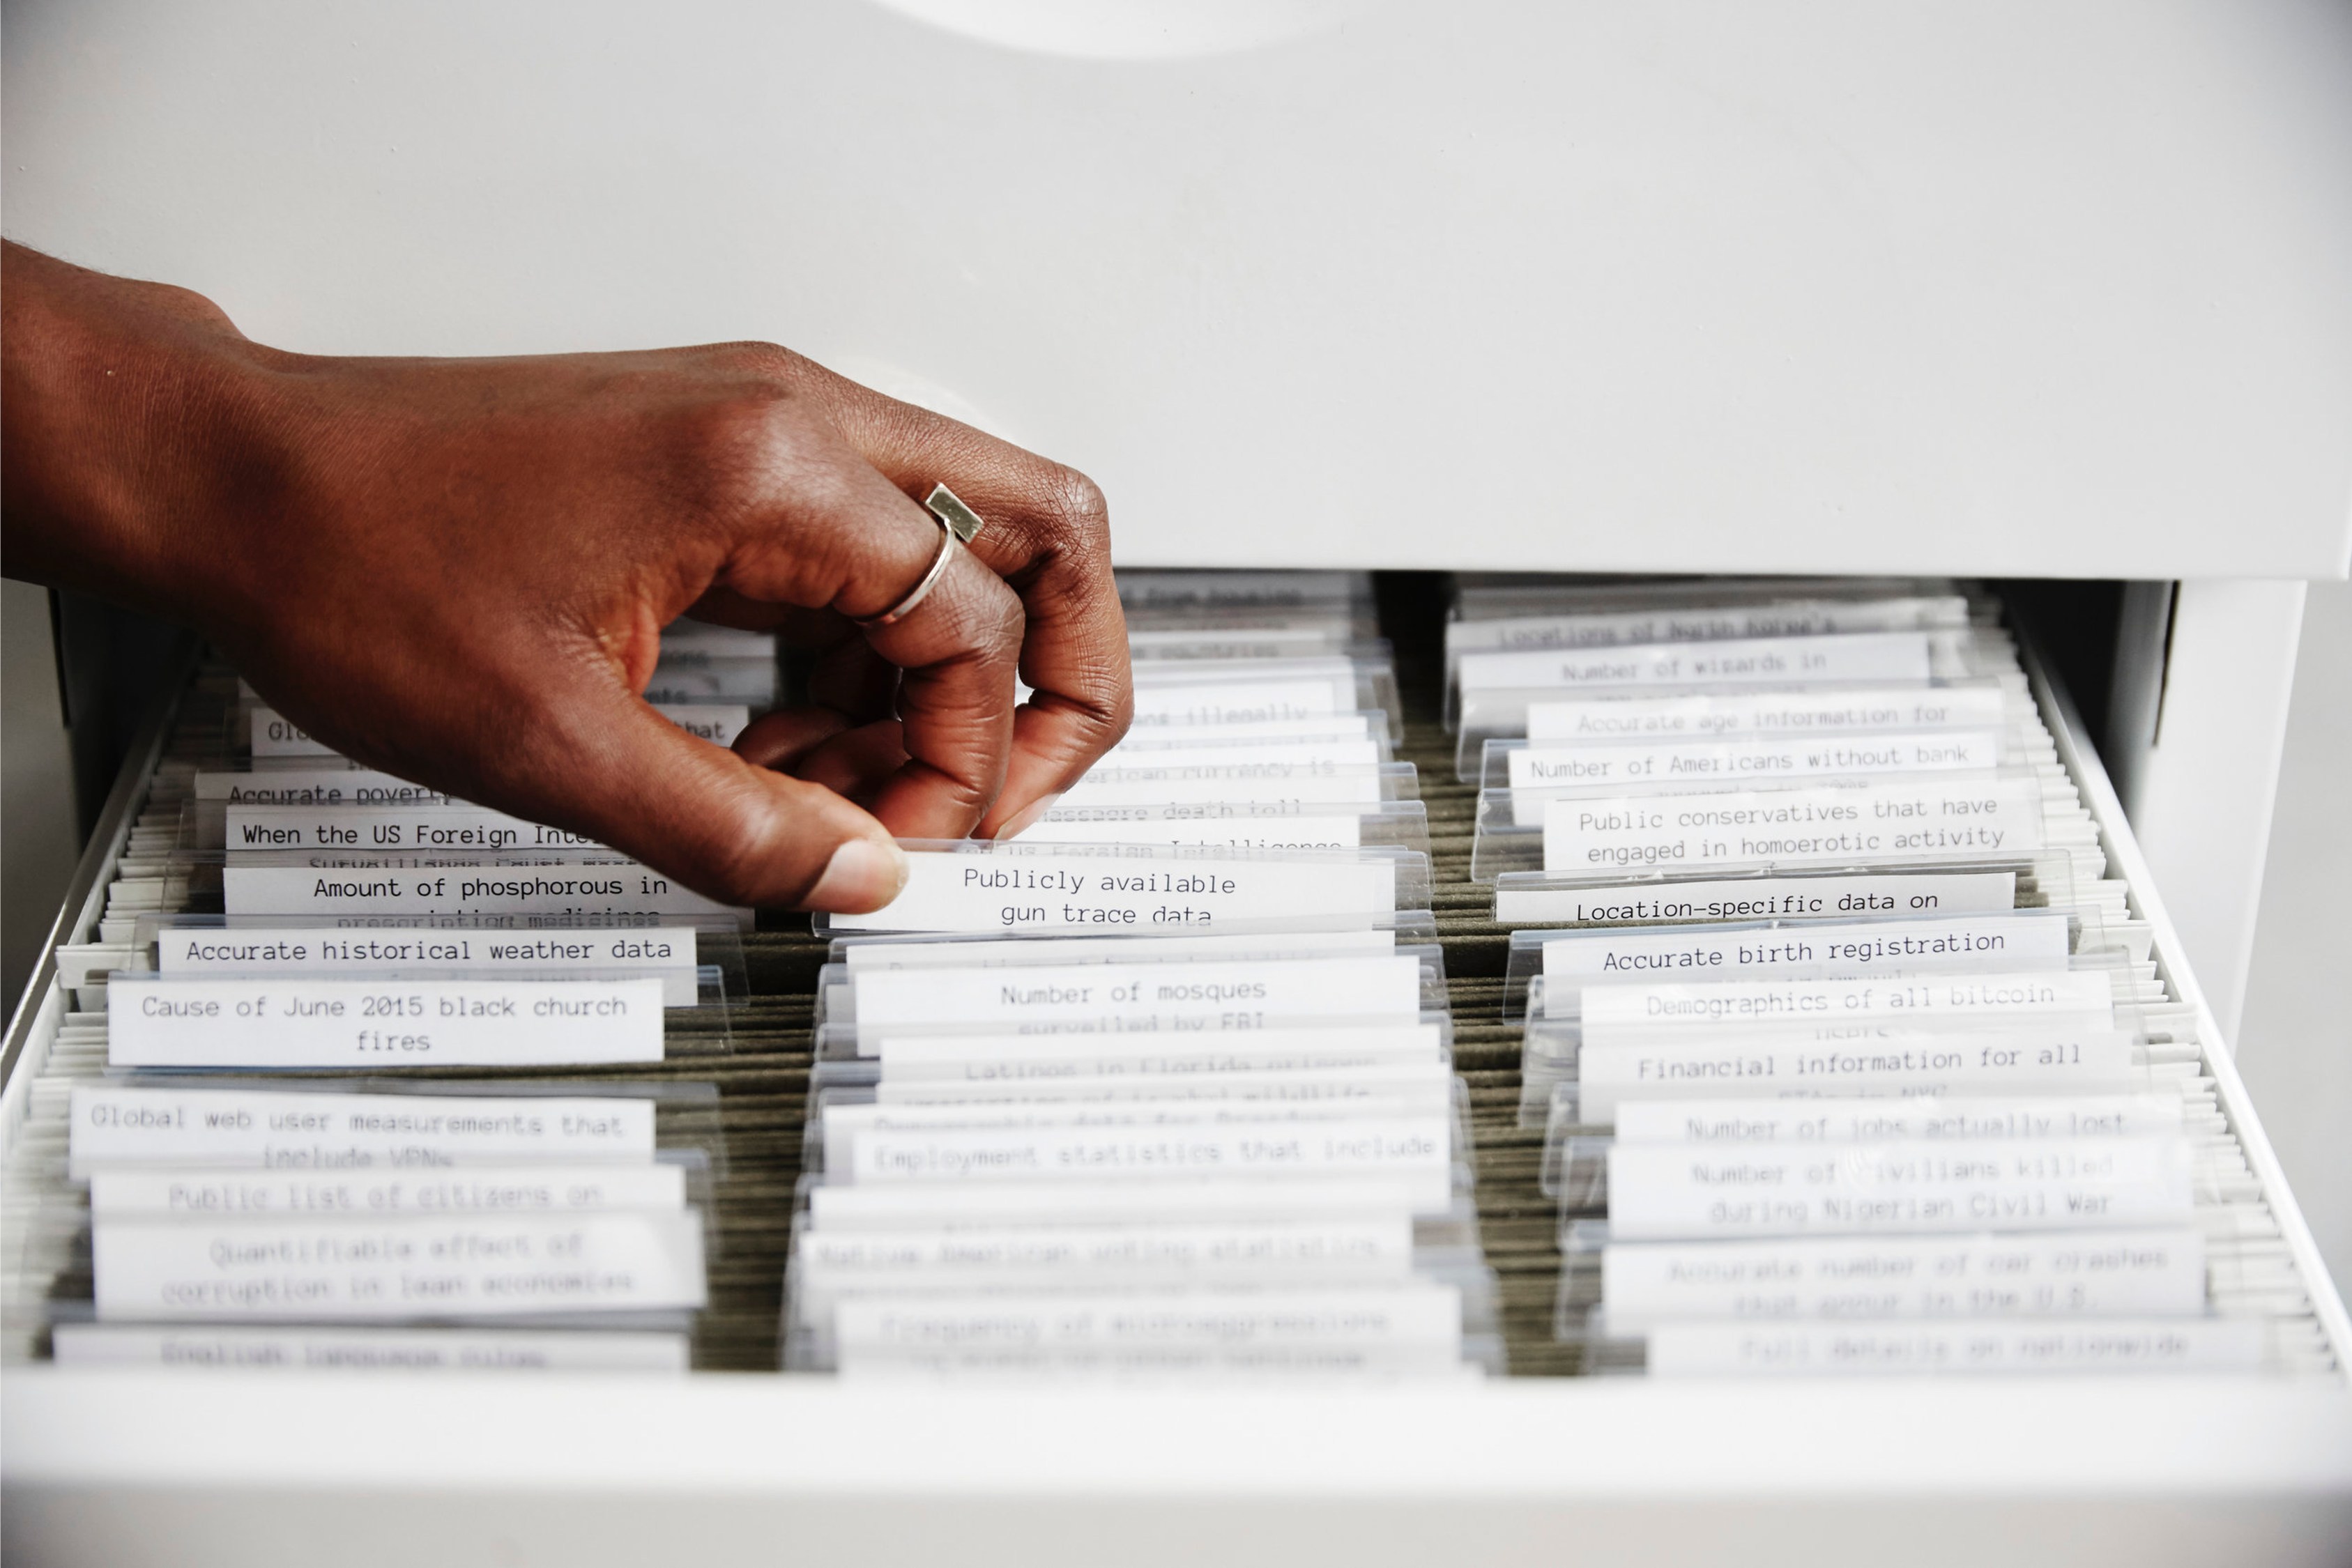
Uh oh, missing, 404, data not found.
This might sounds strange coming from a statistician, but sometimes the most important data story is the story about where the data isn’t.What’s MISSING?
🖼️ Check out the incredible mixed-media installation The Library of Missing Datasets (2016) by MIMI ỌNỤỌHA. It is “a physical repository of those things that have been excluded in a society where so much is collected.
“Missing data sets” are the blank spots that exist in spaces that are otherwise data-saturated.”
👮♀️ This recent article by the marvellous Sapeer Mayron draws attention to a pattern of increasingly missing ethnicity data in police warrants. There are a lot of possible reasons we might see this from the plausibly positive (officers not assuming ethnicity where they might once have?), to the clerical (overly burdensome reporting mechanisms? quality data entry not rewarded/taught/checked?), to the problematic (pressure to minimise known disparities in warrants by ethnicity). In the end, we don’t know why the missing have increased, but I’m glad to see this question being posed.
Other
📺 Watch
Ihaka lecutre recordings A lecture series celebrating Ross Ihaka’s role in the development of the R language for statistics, right here in Aotearoa.
What's Behind the Map: The Process of Data Visualisation by Chris McDowall
How charts lie - and how they make us smarterby Alberto Cairo
Gibbons Lectures 2023: Dr Karaitiana Taiuru - AI Colonisation and Mātauranga Sovereignty
📚 Read
Telling Stories with Data by Rohan Alexander
Rohan has made a version of this excellent textbook FREE online.
If it means to you what it means to me, you’ll be very excisted to know Sir David Spiegelhalter, Andrew Gelman, and Daniella Witten have all endorsed it!
Shouting Zeros and Ones: Digital Technology, Ethics and Policy in New Zealand edited by Andrew Chen
'Understanding how the zeros and ones increasingly influence and control our lives is critical to understanding how we can reciprocate influence and control back onto those zeros and ones.'
This vital book is a call to action: to reduce online harm, to protect the integrity of our digital lives and to uphold democratic participation and inclusion.
A diverse group of contributors reveal the hidden impacts of technology on society and on individuals, exploring policy change and personal action to keep the internet a force for good. These voices arrive at a crucial juncture in our relationship to fast-evolving technologies.
Contributors: Andrew Chen, Kathy Errington, Anjum Rahman, Tom Barraclough, Curtis Barnes, Tahu Kukutai, Donna Cormack, Chris Cormack, Merrin Macleod, Caleb Moses, Stephen Judd, Briony Blackmore, Anna Pendergrast, Kelly Pendergrast and Serena Chen.
Ngā Tikanga Paihere (Statistics New Zealand)
“Ngā Tikanga Paihere draws on 10 tikanga (Te Ao Māori - Māori world concepts) to help you establish goals, boundaries, and principles that guide and inform your data practice.
The 5 principles of Ngā Tikanga Paihere relate to a pair of tikanga with detailed explanations of their meaning, the expectations they relate to, and the things to consider when addressing each.”
West-McGruer, K. (2020). There’s ‘consent’ and then there’s consent: Mobilising Māori and Indigenous research ethics to problematise the western biomedical model. Journal of Sociology, 56(2), 184-196. https://doi.org/10.1177/1440783319893523
“Of interest are the tensions produced by an over-reliance on individual informed consent as the panacea of ethical research, particularly when the research concerns communities who prioritise collective autonomy. These tensions are further exacerbated in research environments where knowledge is commodified and issues of knowledge ownership are present.”
We like patterns and certainty, and that can be a problem
We’re either really good at seeing patterns where they may or may not exist, or at ignoring a more complex picture in favour of the false solidity of a single number.
A primer on reading political polling (ft. Thomas Lumley and Richard Arnold), with useful transferable info on understanding uncertainty, confidence intervals/margin of error, etc.
Random doesn’t feel random enough to us (How your Spotify shuffle does not work and the ‘hot hand’ in basketball.)
I enjoyed chatting with Richard Hulse as he worked on this article on Understanding Consumerswhich includes some great stats ed points.
“Yes, you can draw a line, but this line does not predict where things are going (statistically speaking).The Sharpie is not all powerful!
This is very important to understand. Humans do not naturally discern the difference between a signal and noise, and this results in actions being taken (or celebrations being made) when none are warranted. Humans love to find patterns in things. Burn marks on toast. Pictures in the night sky. We've been doing it for millenia.”
Sometimes we get fixated on a number without putting it in context of its distribution. The shown summary statistics for all the following charts are the same to two decimal places. I don’t know about you, but I’d want to know if there was a T-Rex in my data.
Image description: A GIF with an scatter plot on the left and summary statistics on the right: X Mean, Y Mean, X SD, Y SD, Corr. These are all the same to two decimal places. The plot on the left alternates between a range of shapes, including a star, 9 dot clusters, parallel lines (vertical, horizontal, diagonals), and most importantly, a T-Rex.
Need a statistics buddy for something you’re working on? You can see more of my talks, including some of my general statistics communication on my Talks page.