
Figure 1: SSC 2021 Conference banner. Image description: Map of Canada with pink to red gradient from west to east on a black background. Test in top right says 2021 Annual Meeting - Virtual in English and French. All on black background.
Talks you should go to (very biased recommendations)
Independent Summer Statistics Community (ISSC): Building a sustainable online undergraduate student community with Cocurricular Activities and Experiential Learning Opportunities
1:45 PM - 2:00 PM EDT on Monday, June 7
Abstract
In response to disruptions to our students’ plans due to COVID-19 and widespread feelings of isolation, we built a virtual community to help our students build portfolios, meet peers, and explore careers. In all, over 700 students in our programs signed up, and among the 164 students who responded to our end-of-summer survey, 41% were active and 48% passive participants; our data suggests that even passive participation was beneficial in making students feel more connected. As part of the ISSC, we held formal and informal data science workshops, social events, and career-building activities culminating in a DataFest COVID-19 Virtual Challenge. In all, 92 eligible teams applied to participate in DataFest, 62 were invited to compete, and 42 submitted complete submissions. In this talk, we will outline the principles guiding how the ISSC was structured including practical advice and tips for building a sustainable community, lessons learned, and plans for 2021.
Résumé
En réponse aux perturbations des plans des élèves en raison de la COVID-19 et au sentiment d’isolement généralisé, nous avons créé une communauté virtuelle pour aider les étudiants à monter leur portfolio, à rencontrer leurs pairs et à découvrir des carrières. En tout, plus de 700 étudiants se sont inscrits à nos programmes et, parmi les 164 étudiants qui ont répondu à notre enquête de fin d’été, 41 % étaient des participants actifs et 48 % des participants passifs. Nos données suggèrent que même la participation passive a été bénéfique en donnant aux étudiants le sentiment d’être plus connectés. Dans le cadre de la Communauté statistique indépendante d’été, nous avons organisé des ateliers formels et informels sur les sciences des données, des événements sociaux et des activités de développement de carrière, qui ont débouché au défi virtuel des données DataFest COVID-19. Au total, 92 équipes admissibles ont posé leur candidature pour participer à ce défi, 62 ont été invitées à concourir et 42 ont soumis des dossiers complets. Dans cet exposé, nous présenterons les principes qui ont guidé la structure de la Communauté statistique indépendante d’été, les conseils pratiques et les astuces qui ont contribué à créer une communauté durable, ainsi que les leçons apprises et nos plans pour 2021.
The Development and Implementation of a Toolkit for Learning R at all Levels.
3:45 PM - 4:00 PM EDT on Wednesday, June 9
Abstract
Statistics and data science have become ubiquitous in the hard and social sciences. When working with large data or complex methodology it is crucial that the data analysts are able to program. R is a statistical programming language that is free and popular in the statistics community. R works well for data visualizations, wrangling and employing simple to complex methodology. As educators in statistics we noticed a variation of programming backgrounds in our senior students. Our team of 7 undergraduate students, 2 graduate students, and 2 assistant professors have developed a toolkit to help students improve their programming in R. The toolkit is a set of interactive modules that students complete autonomously. The modules start from the very basics of installing R to tidyverse to employing Bayesian methods. In this talk, we will outline the development and uses of this toolkit, and highlight some next steps.
Résumé
Les statistiques et les sciences des données sont devenues omniprésentes dans les sciences dures et humaines. En travaillant avec des données volumineuses ou des méthodologies complexes, il est primordial que les analystes de données soient capables de programmer. R est un langage de programmation gratuit et populaire au sein de la communauté statistique. Il fonctionne à merveille pour les visualisations de données, leur préparation préalable et l’adoption de méthodologies simples ou complexes. En tant qu’éducateurs en statistique, nous avons remarqué que les formations en programmation varient parmi nos étudiants de cycle supérieur. Notre équipe de sept étudiants de premier cycle, deux étudiants de cycle supérieur et deux professeurs assistants ont conçu une boîte à outils afin d’aider les étudiants à rehausser leurs aptitudes de programmation en R. La boîte à outils est composée d’un ensemble de modules interactifs que les étudiants terminent de façon autonome. Les modules commencent par la base de l’installation de R, puis progressent vers tidyverse jusqu’à l’emploi de méthodes bayésiennes. Lors de cet exposé, nous décrirons les grandes lignes du développement et de l’utilisation de cette boîte à outils, et soulignerons les étapes à venir.
Talk notes
Notes and reflections of varying quality from the talks I attended + resources shared.
Note: If I’ve written about talk and there is anything you’d like me to correct or add, please just let me know! Twitter/email links in the navigation bar.
Invited Presidential Address: Probability, Statistics, and Murder
Jeffrey Rosenthal, @ProbabilityProf
Jeff took us on a journey through his experiences with media and especially as an expert witness in court cases. There are a mish-mash of links below and much more on his website: http://probability.ca.
An example of a case that was especially interesting/surprising was when he was an expert witness in a case about a marijuana grow-op. This story was really neat because significant jail time rests on whether or not the number of plants was more or less than 500. More than 500 leads to a mandatory three-year jail term.
The level of aggressive attacks you end up facing as a expert witness sounds extremely off-putting! I’m glad Jeff’s skin is think enough to go out and do this kind of work, because mine certainly is not.
Some of Jeff’s final notes and advice:
- Statisticians are nicer, especially Canadian ones.
- Be cautious about what consulting work you agree to, especially in an adversarial context.
- You can get paid a lot. Think about whether you want to you negotiate an hourly or fixed rate.
- There are lots of satisfying/important aspects, but also lots of annoying/unpleasant ones, too.
- “If we statisticians don’t do it, then who will?”
Links
Here are several links that were referred to during that talk or shared in chat. (Not exhaustive.)
Lottery link: http://probability.ca/lotteryscandal/
Annals Quadfecta: https://imstat.org/2021/05/14/the-annals-quadfecta-23/
Jeff’s Canadian Supreme Court opinion writing article: http://probability.ca/jeff/ftpdir/SCC_UTLJ.pdf
Discussion of SIDS/SUDI case history: https://en.wikipedia.org/wiki/Sally_Clark
- “The Clark case has its Aussie version that continues as Jeff speaks.” - Grace Chiu https://www.seattletimes.com/seattle-news/health/australian-mom-convicted-of-killing-4-children-seeks-pardon/
www.probability.ca/justice
Data privacy in official statistics (Panel Session)
Donald Estep, Canadian Statistical Sciences Institute and Simon Fraser University, @donestep1
Natalie Shlomo, University of Manchester
John Eltinge, US Census Bureau
Anne-Sophie Charest, Université Laval
Pierre Desrochers, Statistics Canada
- People don necessarily understand what their own views on disclosure/privacy look like mathematically.
- What is inference vs what is disclosure.
- Uniqueness: if you publish something that is unique to one person, that is disclosure and that is fairly well agreed upon. BUT, what about as is scales up? What features makes these different, in context?
- What ‘privacy’ is interpreted as is context dependent, and expressed through jurisdictional law.
- Synthetic data generates new data by random draws from predictive models.
- Differential privacy is a “perturbation tool”, a way to add noise/misclassify probabilistically.
- A wider ethical consider in this area is the question of which predictions are intrusions in unacceptable ways. This is more of an ethical/philosophical. When should we not make inferences?
- How can we learn from others who have been doing risk communication (e.g., around health) to improve our own practices in official statistics
My background is using official statistics for social and health research in Aotearoa New Zealand, so it was excellent to dip a toe back into this world and hear about the context here.
Big thanks to CANSSI for supporting this panel. @CANSSIINCASS
Links
- Duncan, George & Keller-McNulty, Sallie & Stokes, Lynne. (2001). Disclosure Risk vs. Data Utility: The RU Confidentiality Map. https://www.researchgate.net/publication/245939728_Disclosure_Risk_vs_Data_Utility_The_RU_Confidentiality_Map
- Kaloskampis. (2019). Synthetic data for public good. https://datasciencecampus.ons.gov.uk/projects/synthetic-data-for-public-good/
- Near, Darais & Boeckl. (2020). Differential Privacy for Privacy-Preserving Data Analysis: An Introduction to our Blog Series. https://www.nist.gov/blogs/cybersecurity-insights/differential-privacy-privacy-preserving-data-analysis-introduction-our
mverse: An R Library for Teaching and Conducting Multiverse Analysis
Michael Moon, University of Toronto, @micbonmoon
- Motivating example, you’ll get different conclusions based on the choice to keep or remove an outlier when investigating hurricane names and people’s response (question: do people take hurricane’s less seriously if they have a feminine name?).
- Familiar verbs from
dplyr, removes need to do a bunch of error prone copy and pasting (systematic). - Interactive modules are being developed by the team. Great demo of a Shiny app for playing with the hurricane data.
- Submitting to CRAN sometime this summer.
Great presentation from Michael, and I’m super excited about playing with this package!
Links
- Slides: http://www.utstat.utoronto.ca/~moon/mverse-ssc21/#1
- Package on GitHub: https://github.com/mverseanalysis/mverse
- Steegen S, Tuerlinckx F, Gelman A, Vanpaemel W. Increasing Transparency Through a Multiverse Analysis. Perspectives on Psychological Science. 2016;11(5):702-712. doi:10.1177/1745691616658637 https://journals.sagepub.com/doi/10.1177/1745691616658637
Independent Summer Statistics Community (ISSC): Building a sustainable online undergraduate student community with Cocurricular Activities and Experiential Learning Opportunities
Nathalie Moon, University of Toronto
I was part of the ISSC team, so not notes, other than I think Nathalie did a fab job explaining it.
Unofficial list of Canadian universities doing ASA DataFest: U of T, UBC, Waterloo, MacEwan/University of Alberta — we should all be friends!
Links
- Slides (pdf)
- 2020 TidyTuesday activities on GitHub: https://github.com/elb0/ISSC
Online Homework Impact in an Introductory Statistics Course
Tharshanna Nadarajah, University of Toronto
Neat intro to MyOpenMath advantages and how Tharshanna has used it in teaching, student response and outcomes.
Links
- MyOpenMath: https://www.myopenmath.com
Tactile Response Experimental Analysis Toolkit (TREAT)
Sohee Kang, University of Toronto
Some lovely data collection activities that students can do in class from a phone or computer. Love this from the abstract: “Students often feel disengaged with data that they do not perceive as being”real" or “authentic”, and it is important that they believe that the data they are analyzing is representative of real-world problems."
Links
- Movement breaks that can be used in experiments https://ocw.utoronto.ca/movement-breaks/
Q&A for Statistical Education 2 session
- Lot’s of support for using Slack, though size/licensing can be challenging in large courses or with institution policy. Used for the Independent Summer Statistics Community and TA management by some courses at U of T.
- Course emails are extremely helpful! E.g., sta303@utoronto.ca. Add a communication policy to your syllabus about where to go for what. We say course email is only for personal/private matters and everything else should be done via Piazza, e.g., “How many pages should this assignment be?”, “What’s a likelihood ratio test?” etc.
Cautiously Constructing Charts
Michael Correll, Tableau
“We’re just making bar charts, what’s ethically laden about that!” *sarcasm intensifies*
Types of bad visualizations: deceptive, fragile, bullshit 1, evil
Loved the example of the when bar charts should start at 0, but how this ‘rule’ is a major issue when you try to show line graphs of global temperature and demonstrate the serious increases.
- So, when IS it okay to truncate the y-axis? The camps Michael identifies are: the anathemists, the line chart exceptionists, the signalers (be really explicit about truncation!). The things is, there hasn’t really be testing of effectiveness in any of this.
- Further research suggests that rule following isn’t going to cut it! The context of the charts AND the intent are very important.
There are multiple places in the pipeline where things can go wrong, but this means there are places for us to intervene!
- The environment is curated to data which is wrangled to prepared data which is visualized to get an image and that image is read by someone to get a message. (Michael has a nice image to go with this in his slides.)
Any human-computer interaction assistance project eventually just becomes Clippy.
Links
Frankfurt. (1986). On bullshit. http://www2.csudh.edu/ccauthen/576f12/frankfurt__harry_-_on_bullshit.pdf
McNutt, Kindlmannn & Correll. (2020). Surfacing Visualization Mirages https://arxiv.org/abs/2001.02316
Correll. (2018). Ethical Dimensions of Visualization Research. https://arxiv.org/pdf/1811.07271.pdf ) if that helps.
The Case Against Explainable Artificial Intelligence and Machine Learning
Boris Babic, INSEAD but soon to be U of T
White box (like a good ol’ GLM that is easy for a human to understand) vs a black box (e.g., deep learning models), but of course there is lots of potential for grey boxes, like how many parameters is too many? What about level of understanding of the user?
Explainable vs interprettable
‘Ersatz understanding’: in law/philosophy the idea of understanding is based in the ‘why’ between input and output.
- Why isn’t this genuine understanding? Example given of post-hoc judge’s assistant noticing a pattern and saying that is why a decision was made for denying parole, when really there could be other reasons. The assistant is the white box approximation, but the judge is the black box. ‘Pseudo-understanding’.
We want explainable systems because this is tied to our ideas around accountability and trust.
We also want robustness (e.g., we’d expect similar advice for similar patients in a health context). White box approximations can give us a sense of ocal faithfulness but the potential to produce super different outcomes.
In summary, the main issues are pseudo/ersatz understanding—we have a false impression that we do understand what the black box is doing, the potential for non-stability when trying to use approximations, and the challenges due to existing issues with statistical literacy of data product users. Assumptions about causality, etc.
Links
- Thanks to Jim Stallard for recommending Data Visualization: Charts, Maps, and Interactive Graphics by Robert Grant https://www.goodreads.com/book/show/40684954-data-visualization
- Boris and collaborators have a paper coming out in this topic. Keep an eye on his website: https://borisbabic.com/research/
Closer Than They Appear: A Bayesian Perspective On Individual-Level Heterogeneity In Risk Assessment
Kristian Lum, UPenn, @KLDivergence
- Kristian is so cool and I love any and every opportunity to hear her speak!
- This presentation is introducing a new project around failure-to-appear in criminal processes.
- FAT/FACT/FATE (algorithmic fairness acronyms)
- There are differences between ideas of GROUP fairness and INDIVIDUAL fairness (“people who are similar should be treated similarly”). Kristian found that this was already being discussed in the risk assessment literature but in a different way. Group probabilities and uncertainty around group-wise rates.
- “People are certainly more than the weighted sum of their covariates”
- We tend to have to make the assumption, if we’re only observing each person once, that their individual probability will be approximated by the group probability. This feels naughty.
- What about when you DO have multiple observations per person? Well, it allows us to “take seriously” the idea that each person should only be judged on their own actions. When using group probabilities, you are being ‘judged’ through the actions of others.
- In this project they are looking at using Bayesian random effects distributions and testing with a large Kentucky dataset. This tends to show us that we’re in the ‘large variance’ situation where people are not closely grouped around their group mean.
- Risk assessments affect the trajectory of real people’s lives.
Links
- Angwin, Larson, Mattu & Lauren Kirchner. (2016). ProPublica. Machine Bias. https://www.propublica.org/article/machine-bias-risk-assessments-in-criminal-sentencing
On the Use of Auxiliary Variables in Multilevel Regression and Poststratification
Yajuan Si, University of Michigan, @yajuansi
- MRP (“mister P”) is multilevel regression (MR) and poststratification (P)
- “A model-based perspective of poststratification”, Gelman and motivated by Little (1993)
- Proposed as a combo of modelling and design.
- Rooted in survey research but also modelling and has strong assumption, reliance on auxillary variables.
- Fewer auxiliary, the better BUT it may violate conditional independence assumptions about cells. When constructing cells should use variables highly correlated with the outcome.
- “Shrinking from both sides”.
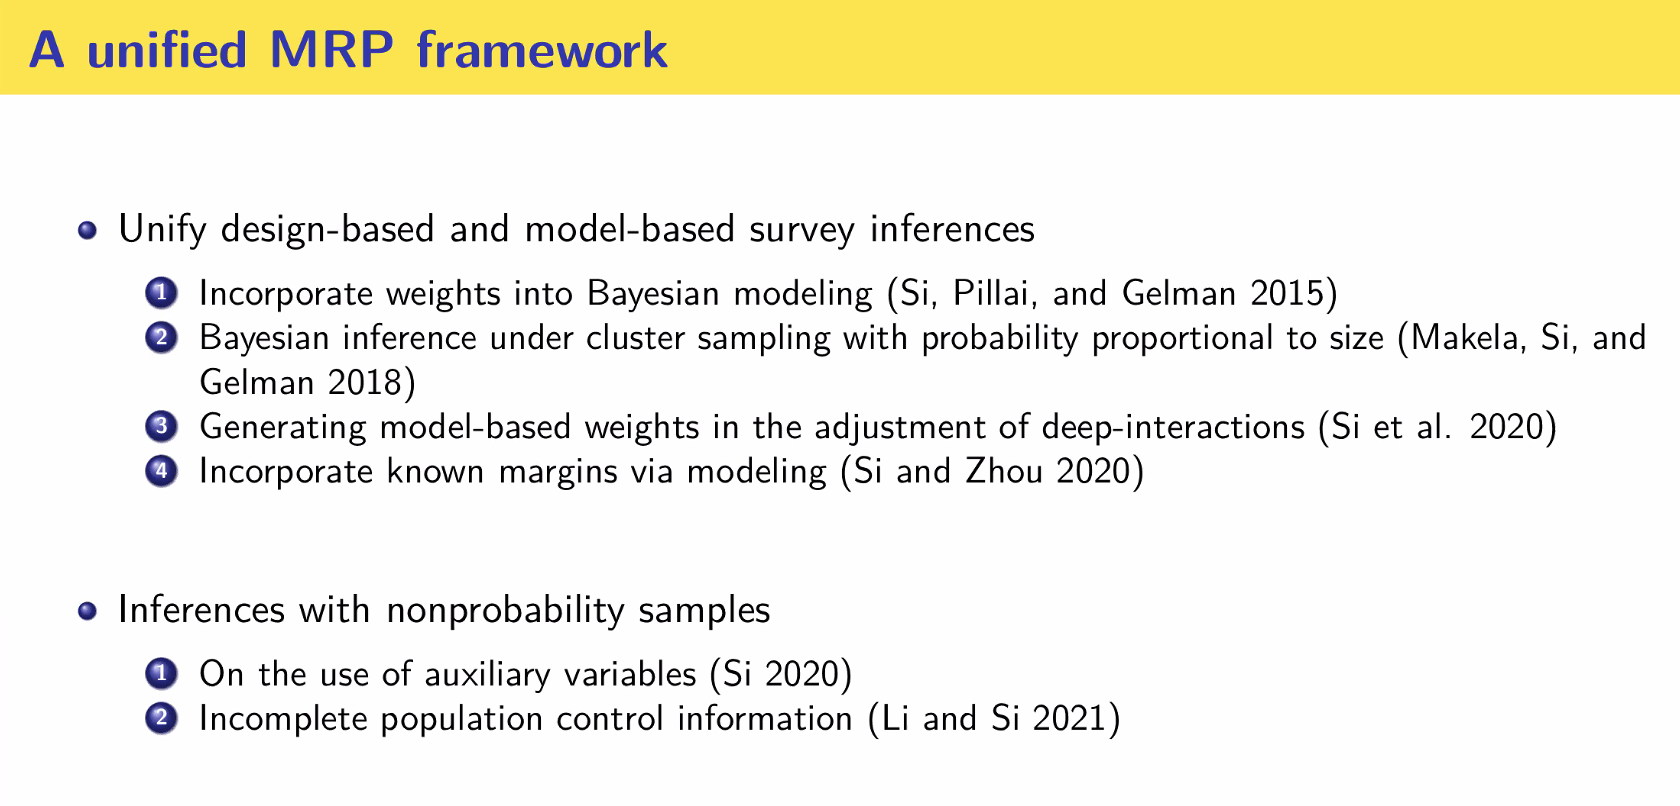
Figure 2: List of papers about MRP authored by Si and colleagues
Links
- Little. (1993). Post-Stratification: A Modeler’s Perspective. https://escholarship.org/uc/item/4np24519
- See list of papers above
Survey Calibration via the Generalized-Method-of-Moments (GMM)
Heng Chen, Bank of Canada
- Motivation: reports that people were concerned about transmission of COVID-19 via cash.
- Consumer surveys to understand how people were using cash in response to the pandemic. April, July and November 2020. Interested in changes between first and second waves.
- Three main variables of interest: Cash on hand, what proportion of people are using cash, what proportion of people plan to go cashless.
- Have repeated cross-sections and longitudinal data.
- For cross-sectional data, considering propensity score, selection into surveys. Then can condition on Y on selection in to the given survey. Compare \(Y_1 | S_I\) with \(Y_2|S_2\)
- For longitudinal, there is another ‘propensity’, that is to stay in both surveys, as well as the selction into the two survey waves.
- “covariate balancing”, propensity scoring has two jobs: modelling the choice and balance between weighted sample and unbiased targets. The weight (with the PS) is what helps up balance the observed value to the unbiased target.
- Advantages of covariate balancing propensity scores: calibrated weights dual problem, “robust to (parametric) misspecification”, can use GMM (stacking moments to get other parameters), flexible about the unbiased targets.
- First, choose the covariates for the PS - they will be your denominator for the moment calculation. Second, get functional forms for the propensity scores for the selection into each survey and attrition measure (for longitudinal).
- Results for the cash research: Some decrease in cash on hand, but increase in having used cash and
Links
- Chen et al. (2020). Cash and COVID-19: The impact of the pandemic on demand for and use of cash. https://www.bankofcanada.ca/wp-content/uploads/2020/07/sdp2020-6.pdf
An initiative for promoting an inclusive, equitable and diverse environment at SSC
Nothing specific to say other than how glad I am that SSC and NSERC and CANSSI and partner institutions are committed to improving EDI.
Folks to follow: @BouchraNasri, @donestep1, @statacake, @alejandroadem
A Gentle Introduction to the Poisson Process for a Third Year Probability Course
Lengyi Han, UBC
Han proposes that the usual ways of introducing Poisson processes and notation can be quite difficult for students, especially to connect to real world examples.
Motivation with a Bernoulli process example (arrivals at a bank)
Suppose we divide the time in question (say 60 minutes) into equal sub-intervals and a person can only arrive at the midpoint of a sub-interval.
If we make finer and finer sub-intervals we show that the Poisson and Bernoulli process will be approximately the same for sufficiently large \(n\).
After the above, reiterate the assumptions and conditions for a Bernoulli process. From here, students can see that as the interval width tends to 0, we get the Poisson dist.
Specifically, the Bernoulli procress avoids the use of \(o(h)\) notation and student work through the derivation, motivating the use of this notation as helpful instead of obscure.
- Use Taylor expansion
Links
- Lawerence Leemis on YouTube https://www.youtube.com/channel/UCoXVQ0xV2VOk3XrREv5061w
The Development and Implementation of a Toolkit for Learning R at all Levels
Sam Caetano (presenting), University of Toronto @StatisticalSam
Also check out: @RohanAlexander, @michaelycchong, @pailfodgetts
- This was an awesome example of a large team education innovation project! 2 faculty leads, 2 graduate students and 8 undergraduate students (+support from the department)
- Students learned a lot about GitHub and collaboration as part of their RA roles.
- There are introductions for complete beginners and it is also very ‘jump-in-able’ for folks who are already some of the way there.
- Suggested implementation: could have quiz questions in class quizzes related to the
Links
- Toolkit home page: https://dosstoolkit.com/
- Read the paper! https://arxiv.org/abs/2105.09347
learnrpackage is great for creating interactive tutorials: https://rstudio.github.io/learnr/
Developing and Revising the Student Survey of Motivational Attitudes Toward Statistics: Results from a Pilot Study
Douglas Whitaker, Mount Saint Vincent University @DouglasWhitaker
S-SOMAS: Student Survey of MOtivational Attitude toward Statistics
One of family of 6 instruments. 2 x topics (statistics, data science) across 3 x types (student, instructor and environment)
MASDER: Motivational Attitudes in Statistics and Data Science Education Research team
“Expectancy-Value Theory”: achievement-related choices and performance are affected by what you value and what you expect to happen. EVERYTHING else operate through one or both of these.
Use PCA, check the loadings/dimensionality before item response theory.
- Example given of ‘who can do stats’ vs ‘overall difficulty’ on the ‘difficult’ scale. The two ‘who can do’ items looks different to the others.
- Saw some substantial misfit
eRmpackage (Mair et al., 2021),mirtpackage (Chalmers, 2012) for generalized partial credit.
I’m looking forward to seeing how these tools develop!
Using a “Midterm Warning System” to Improve Student Performance and Engagement in an Introductory Statistics Course: An ongoing RCT Study
Nooshin Rotondi, Ontario Tech University
- Background: intro stats for health care students, ‘have to’ be there as opposed to choosing statistics
- Measured demographics, response on scale and performance
- RCT with two groups, intervention (personalized email) vs control (no personalized email, as per standard practice)
- All resources mentioned in personalized emails had been previously shared with the whole class as part of standard practice.
Loved this talk! Excited to see next steps.
Links
- Deslauriers et al. (2012). Transforming the Lowest-Performing Students: An Intervention That Worked. https://www.sei.ubc.ca/bitstream/seima/2141/1/Harris_Intervention_JCST2012.pdf
- Gordanier, Hauk & Sankaran. (2019). Early intervention in college classes and improved student outcomes. https://www.sciencedirect.com/science/article/abs/pii/S0272775718305272
Data Science and Analytics Section Workshop
Chris Holdgraf, 2i2c.org, @choldgraf
An article about computational science in a scientific publication is not the scholarship itself, it is merely advertising of the scholarship. The actual scholarship is the complete software development environment and the complete set of instructions which generated the figures.
~ Buckheit and Donoho
WaveLab and Reproducible Research, 1995
“Jupyter and the last mile problem”
“Jupyter is a community of people and an ecosystem open tools and standard for interactive computing”
Language agnostic: “empower people to use open tools”
Metaphor of getting you to a coffee shop: walk? pay someone to drive you? use public infrastructure?
- What Chris would prefer (for himself and us all) is the public option!
- Take this idea and apply it to creating a great technical report.
The notebook experience combines a document standard, and environment (R, Python, etc.), and an interface.
Notebooks are “structured but generic”. The can have many different front ends, for example:'classic’, JupyterLab and nteract.
JupyterLab is meant to provide a more flexible and customizable space. It is sandalone as a UI, but you can also put components together, Lego-style into the UI you need.
Real-time collaboration is being worked on!! Still an early prototype, but I am so excited.
Jupyter Book and MyST (pronounced ‘mist’)
Markdown is usually not extensible, but MyST lets you set out roles and directives. Can add images and include references.
Want JupyterHub for a small user base (2-80 people)? The Littlest JupyterHub (tljh.jupyter.org). For larger groups, JupyterHub on Kubernetes.
Data8.org / inferentialthinking.org
We’ve been using JupyterHub in teaching at U of T for almost a year now, and it has been working really well. I use it with R and it also allows us to use RStudio which is really nice. Big thanks to Nathan Taback who has been leading this from our side, and to the members of 2i2c.org that have been helping us. Highly recommend.
I really like Chris’ emphasis on design principles in this talk.
The rest of the session was hand on workshops from David Liu, Nathan Taback ( @NathanTaback) and Nathaniel Stevens. https://github.com/ssc-datascience/pythonjupyter_wshop2021 They were really good!
Links
- Chris Holdgraf’s personal website: https://predictablynoisy.com/
- Jupyter https://jupyter.org/ and JupyterHub https://jupyter.org/hub
- https://2i2c.org/ (Chris is Director)
- Binder https://mybinder.org/
- JupyterBook for publishing https://jupyterbook.org (like bookdown, cool!)
- Gorgeous images from Scriberia about data work: https://zenodo.org/record/3332808
- Pangeo https://pangeo.io a community platform for Big Data geoscience
Reading list
Books
Knock on Wood: Luck, Chance, and the Meaning of Everything by Jeffrey S. Rosenthal https://www.goodreads.com/book/show/36300756-knock-on-wood
Data Visualization: Charts, Maps, and Interactive Graphics by Robert Grant https://www.goodreads.com/book/show/40684954-data-visualization
Articles
- Jeff’s Canadian Supreme Court opinion writing article: http://probability.ca/jeff/ftpdir/SCC_UTLJ.pdf
- Kaloskampis. (2019). Synthetic data for public good. https://datasciencecampus.ons.gov.uk/projects/synthetic-data-for-public-good/
- Steegen S, Tuerlinck F, Gelman A, Vanpaemel W. Increasing Transparency Through a Multiverse Analysis. Perspectives on Psychological Science. 2016;11(5):702-712. doi:10.1177/1745691616658637 https://journals.sagepub.com/doi/10.1177/1745691616658637
- McNutt, Kindlmannn & Correll. (2020). Surfacing Visualization Mirages https://arxiv.org/abs/2001.02316
- Correll. (2018). Ethical Dimensions of Visualization Research. https://arxiv.org/pdf/1811.07271.pdf ) if that helps.
- Deslauriers et al. (2012). Transforming the Lowest-Performing Students: An Intervention That Worked. https://www.sei.ubc.ca/bitstream/seima/2141/1/Harris_Intervention_JCST2012.pdf
In the sense of Frankfurt’s On Bullshit http://www2.csudh.edu/ccauthen/576f12/frankfurt__harry_-_on_bullshit.pdf↩︎